Creating & Using Charts
This page will show you how to create the different types of Charts as well as how to edit and customise them for your needs.
Creating Charts
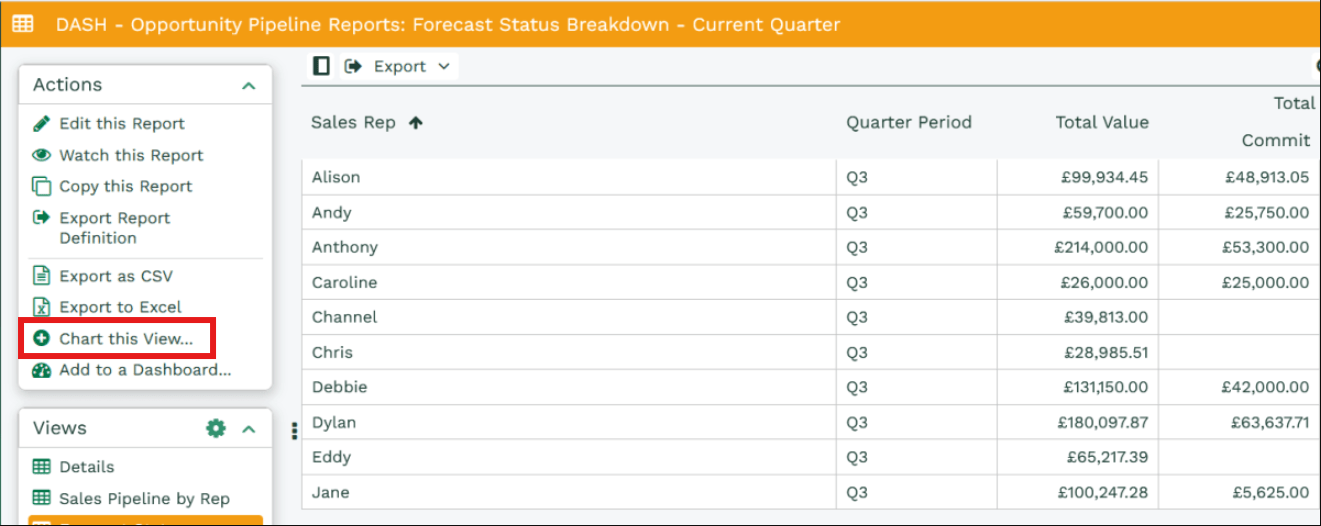
To create a Chart you will need click on Chart this View to the left of the Report grid.
Note: Charts can only be generated from a view that contains numeric values or calculated columns that are recognised as outputting a number rather than a string.
This will allow you to select the type of Chart you want to create from the Report View.
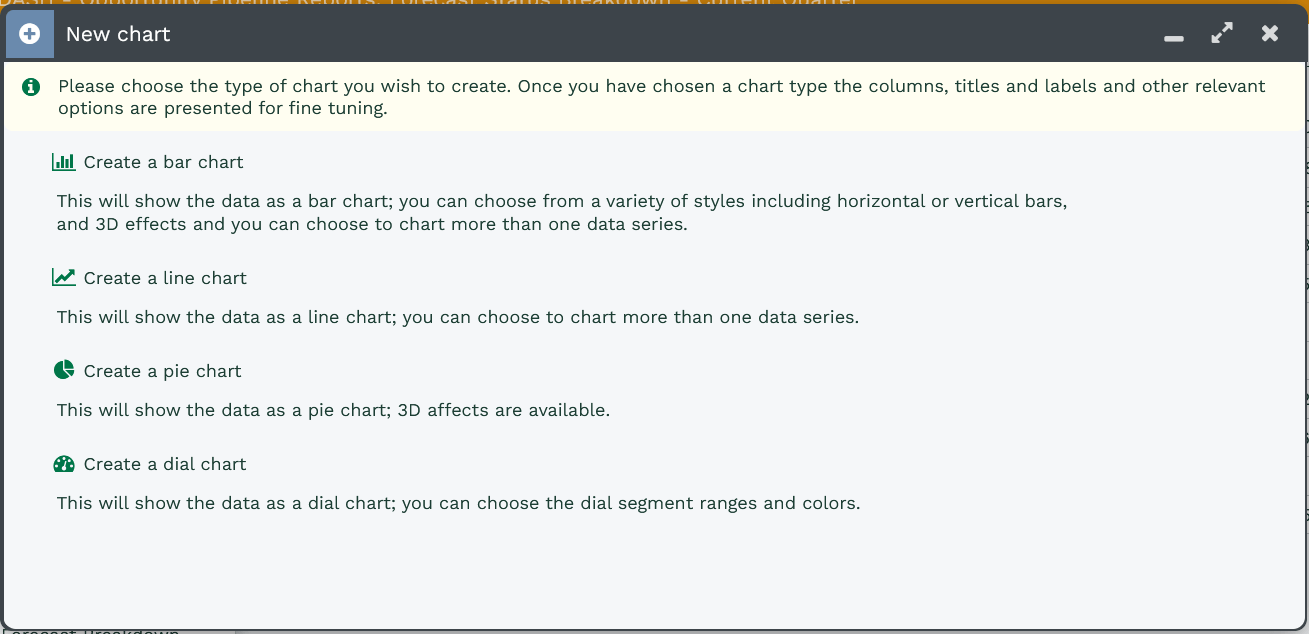
You can set up and customise your Chart. All of these settings can be later edited once setup has been completed.
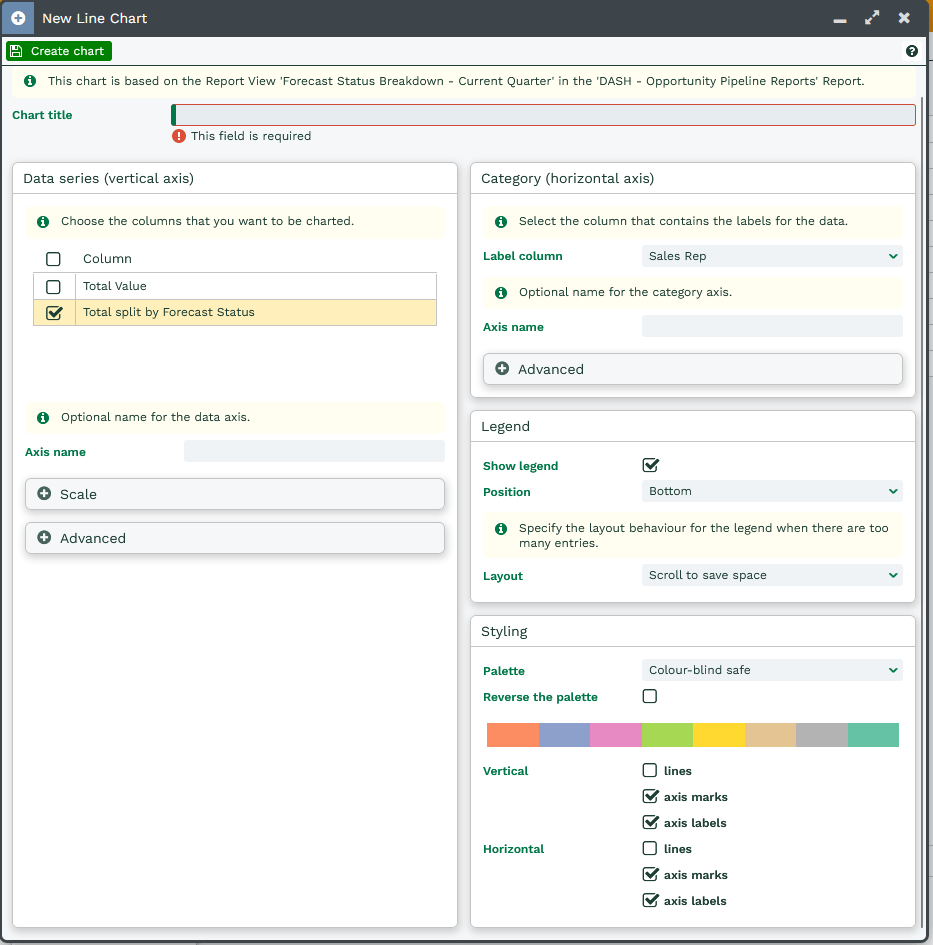
Chart settings will vary depending on the Chart type; you can find these on the following Knowledge Base pages specific to each of the Chart types: Bar Charts, Line Charts, Pie Charts or Dial Charts.
Editing a Chart
You can open and amend the chart view (as needed). The chart can be opened from the report that it was generated from and found under the views section.
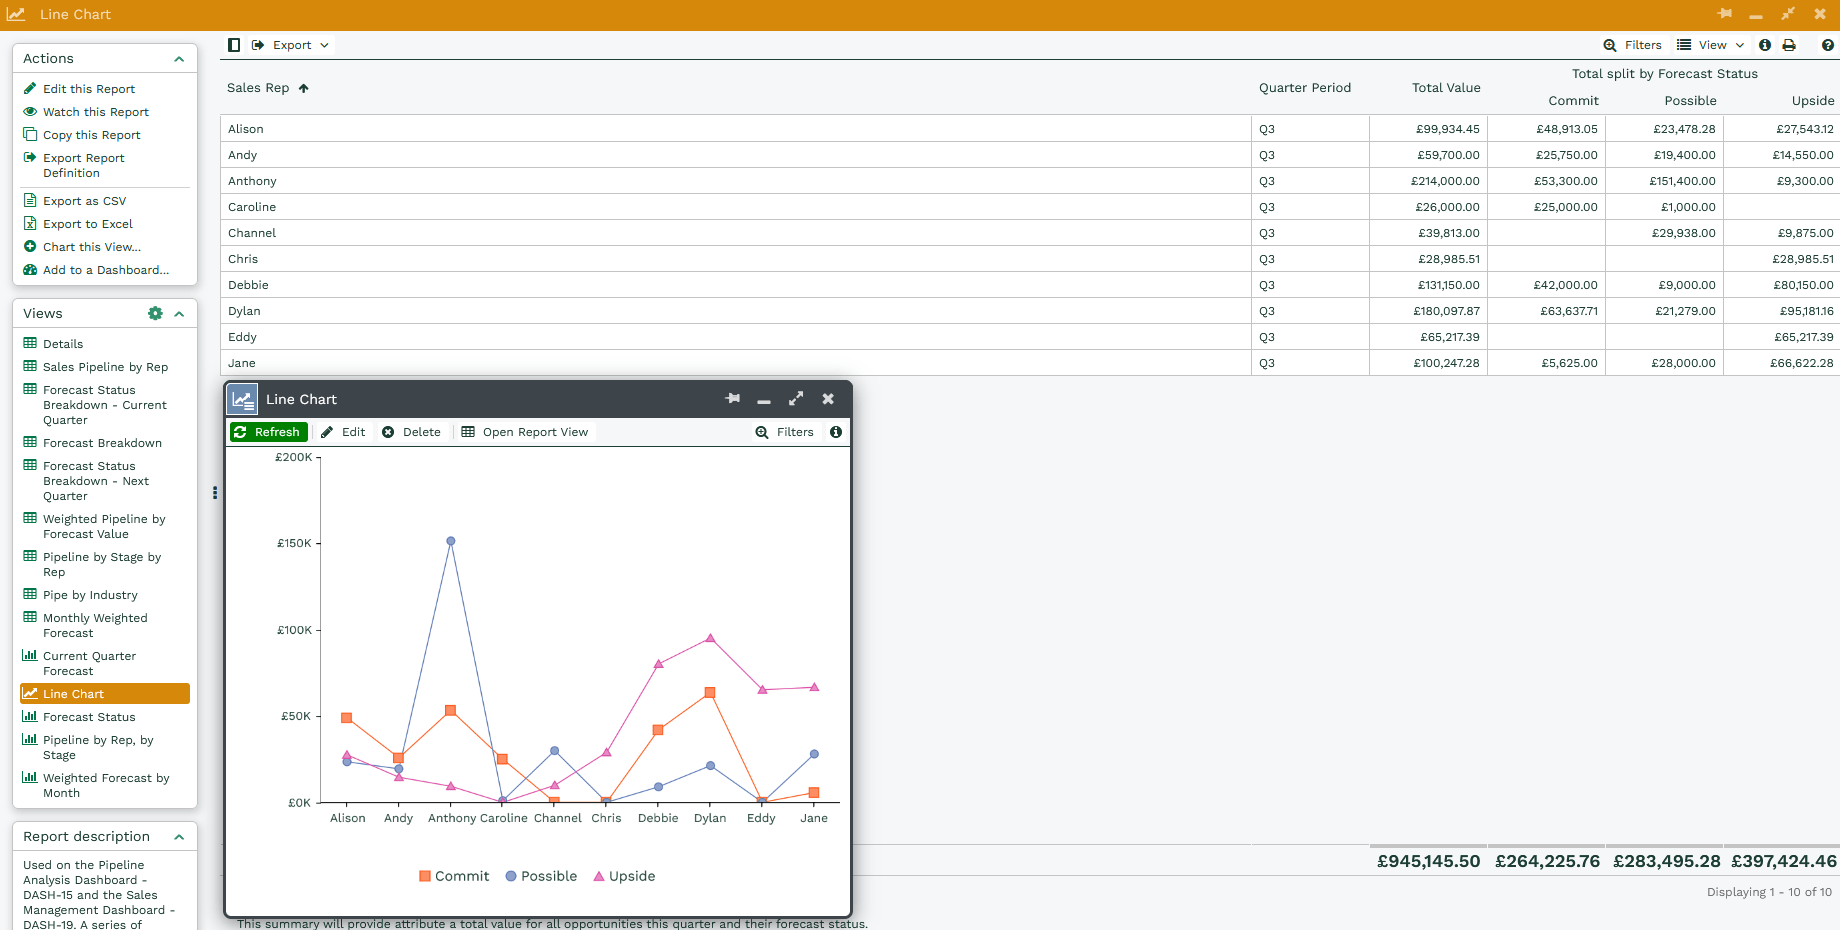
There is a menu bar along the top of the Chart that provides you with an Edit option.
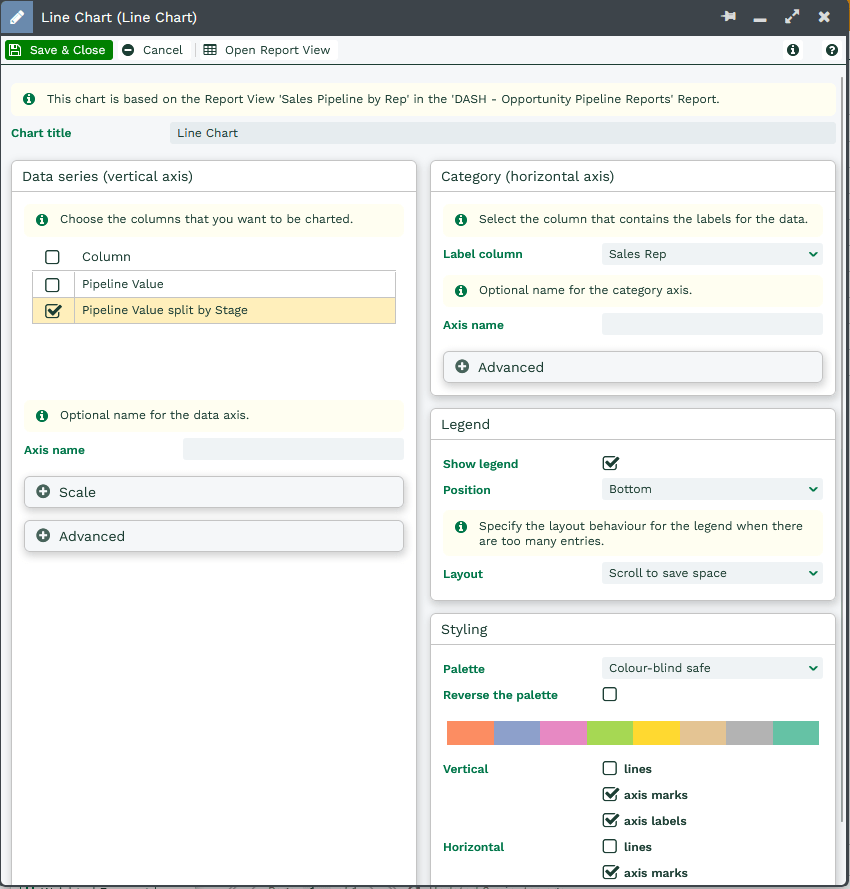
Selecting the Edit option opens the settings menu that was used to initially configure the Chart; these settings can be amended as required.
Charts will show certain values by default. These are listed below:
Bar Charts:
- Show value son their bars by default
- Show values on mouseover by default
- Show values on mouseover by default
- Show grand totals by default.
- Show actual and visible values by default.
Line Charts:
- Show values on mouseover by default.
Pie Charts:
- Show grand totals by default.
- Show actual and visible values by default.
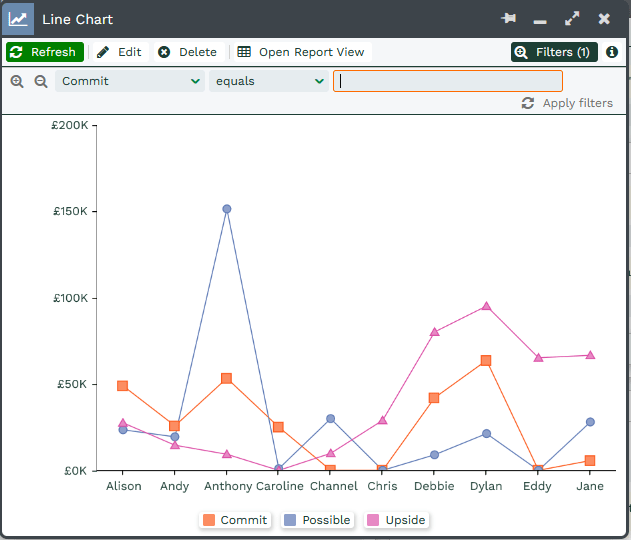
Filtering Charts
You can reduce the data down further by applying a Filter to any Column within the Report View. All Charts come with a Filter button that can be applied in the same manner as a Landing Page or Report.
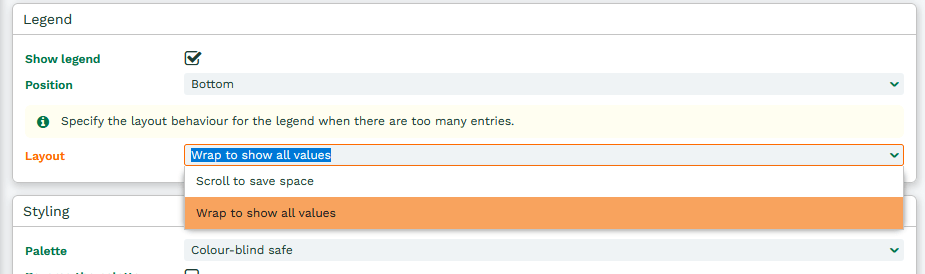
Using the Legend
For Bar Charts, Line Charts, and Pie Charts, you can customize the legend using the options available in the Legend section:
- Show Legend – Toggle this option to display or hide the chart legend.
- Position – Choose where the legend appears on the chart. Available options include: Top, Bottom, Left & Right.
- Layout – Adjust the Layout of the legend. The available layout options include: Wrap to show all values, Scroll to save place
Drilling into Charts
Similar to drilling into a Report, it is possible to drill into a specific part of a Chart. By selecting a marker or segment of the Chart, a new menu will appear, providing you with the option to drill into the data for that specific section.
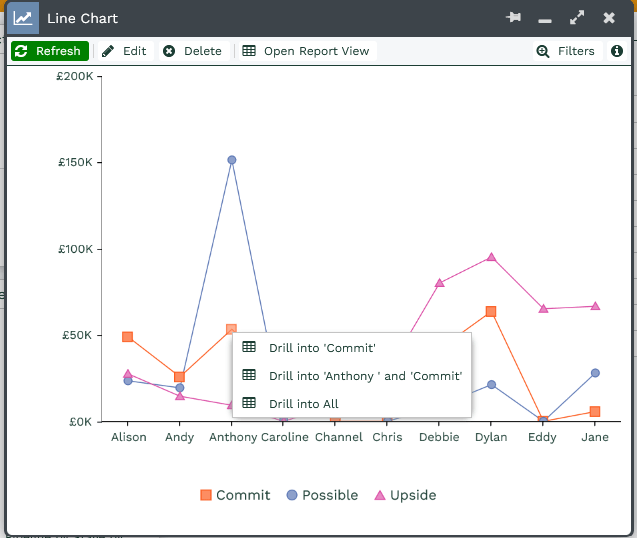
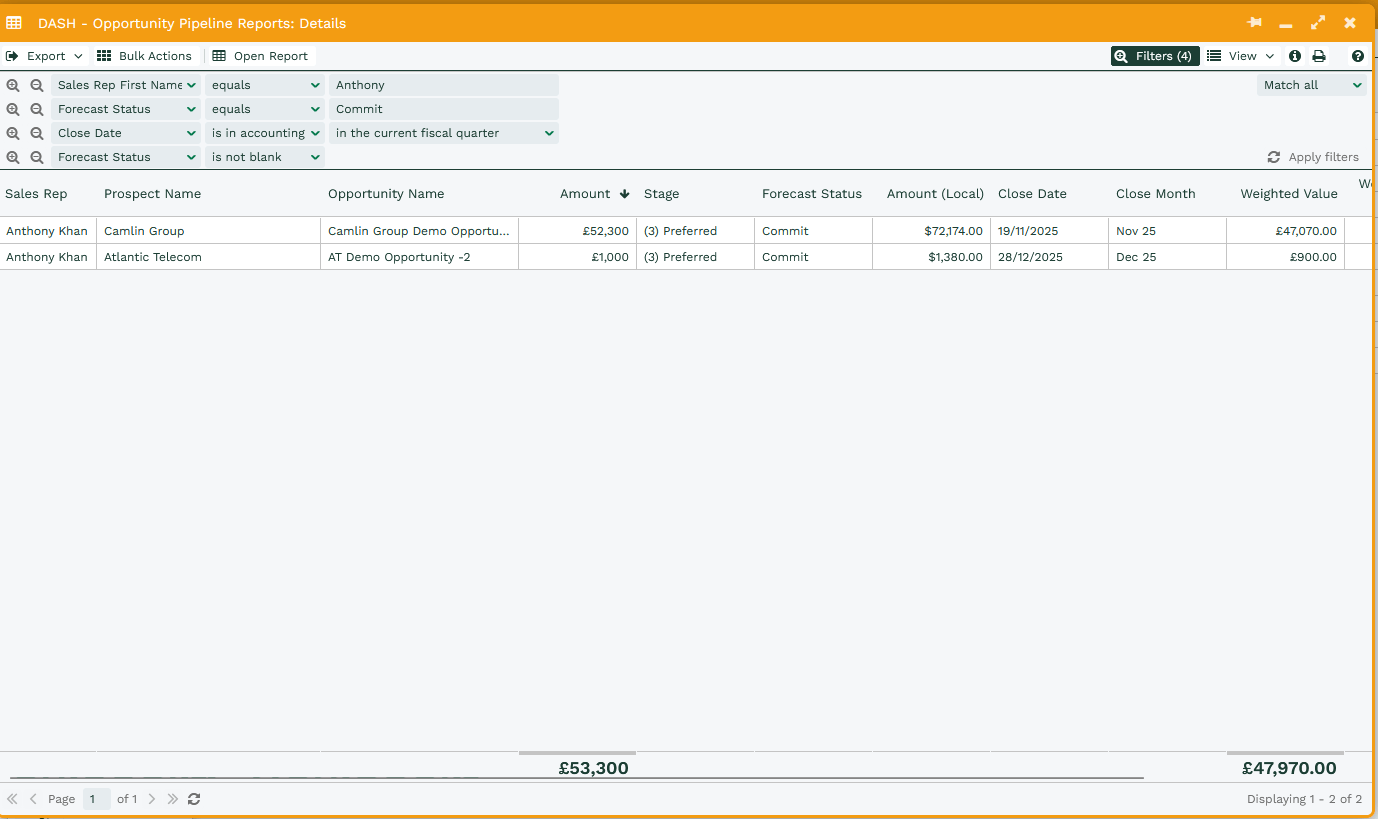
Selecting this will cause a new Report window to open, displaying the Report View that the Chart is based on, with the appropriate filters applied to the show you the data you are drilling into in grid form.
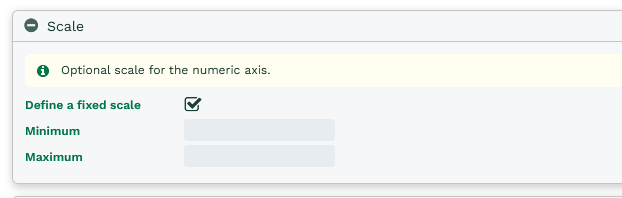
Controlling Axis
You can specify the minimum / maximum values on the numeric axis for a chart. Therefore, this means that it’s possible to display similar graphs side by side in a dashboard (using matching scales). E.g. Last year’s values vs this year’s sales total values may be on a different scale. So a value of 100 (scale of 1-120) will look similar to a value of 10 (with scale of 1-12). This is now controllable.
When creating a chart, you will see a heading for scale:
There is a checkbox you can select to set a defined scale. The minimum and maximum values can be set accordingly (based on values in your report).