


Reading Process Logs
Being able to read your own process logs is incredibly helpful for diagnosing issues. They allow you to trace what went wrong and plan the right steps to fix the problem—and prevent it from happening again.
Process logs record each step a process takes during execution. You can access them in two ways:
- Navigate to Start > Configuration > Automation > Processes, then select the relevant process and go to the Logs tab.
- Or go directly to Start > Configuration > Automation > Process Logs.
The amount of detail you see in the logs depends on two factors: the script engineer who wrote the process and the log level set for it. By default, if a process fails, it switches to Debug mode—the most detailed log level. Otherwise, unless manually changed, it runs in Info mode, showing only the log entries the author has explicitly included in the script.
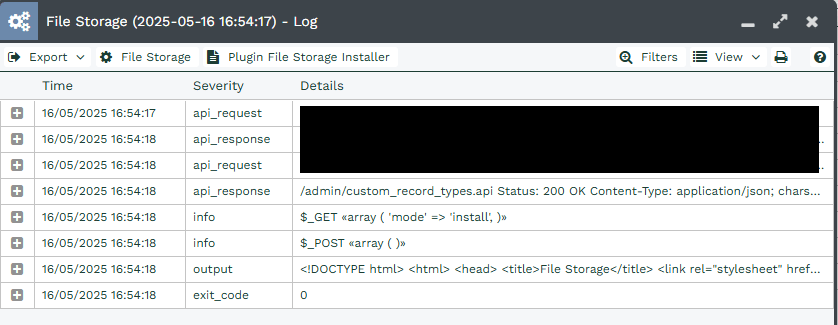
As an example, info logs will usually be quite concise, like this:
Whereas debug logs will look more like this – you can see the individual API calls being made:
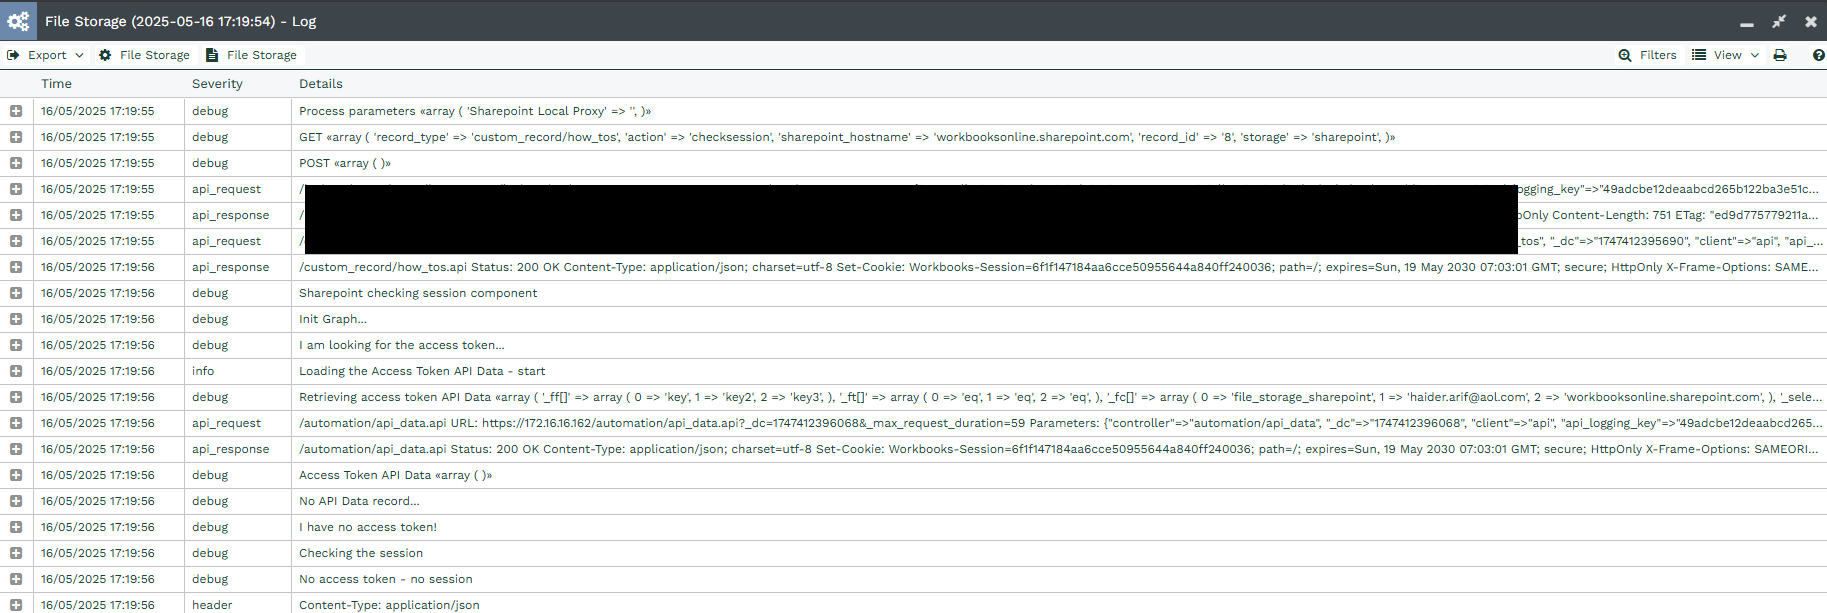
You will notice that API requests and responses always come together in a pair. The request is what the script is asking of the API, and the response is what the API is feeding back to the script.
From left to right we have the timestamp, the severity (log type), and the details of what exactly the process was doing.
If you expand a line using the plus icon on the left-hand side, a window like this will open with more detail about the nature of the request:
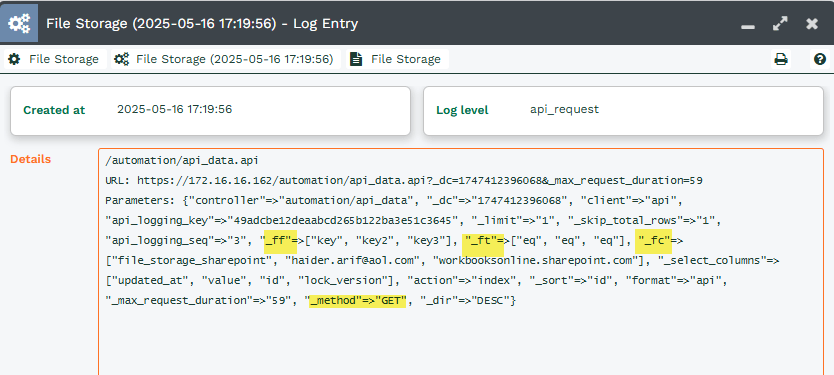
Highlighted are some details of what ‘filters’ are being used. You can also see whether this was a GET or a PUT request. These are fairly self-explanatory, a PUT means you’re creating or updating records, and a GET means you’re retrieving information from the API.
Each of these filters has a different function:
- ff_ = the fields we are filtering on
- ft_ = the operators we use
- fc_ = the conditions we are applying
- fm_ = the matching rules if there are multiple conditions (similar to what you get with filters on a landing page in the UI, so ‘1 AND (2 OR 3)’ for instance)
- eq = is equal to
- neq = is not equal to
- ct = contains
- nct = does not contain
- gt = greater than
- ge = greater than or equal to
- lt = less than
- le = less than or equal to
There are a few other helpful commands to look out for:
- _limit specifies the number of rows to fetch (by default this is 100)
- _sort gives the field to sort by (for instance, show me created at, sorted by the most recent)
- _start is which row to start from (in most cases this will be 0, but you will sometimes see this when fetching records in batches)
- select_columns specifies certain fields in cases where you don’t want to see all fields
More information on this can be found on our Github, available here (https://github.com/workbooks/client_lib#filtering-types)