


Reporting Explained
A detailed explanation of the key screens/tabs you will come across when creating reports in Workbooks.
Reporting is a big topic, so before getting started it’s important to note that reports can have multiple views and to understand a few key terms. Please take the time to read these bullet points.
Contents
- Introduction
- Main tab
- Details tab
- Summary tab
- Columns tab
- Advanced tab
- Style tab
- Criteria tab
- Automation tab
Introduction
- Real-time – Reporting is real-time, meaning it always shows the current data in your system. If records are added, deleted, become included or excluded by a report’s criteria, the report will reflect this.
- Details view – This view lists all the data you need to see, perform calculations on, summarise or group by.
- Summary views – Summary views are created from the Details view. They contain summarised figures for a group of records e.g. Total Value for each Opportunity Stage, or the number of phone call activities created this week for each Salesperson.They also feature the ability to split the summarised data into multiple columns. Consider an Opportunities report. You can group by the Assigned to field. This will give you the total values of Opportunities sub-totalled by Salesperson, but you can also split the data by Opportunity Stage.This report will give a breakdown of what Opportunities each Salesperson is working on, on a single row, but it’s also split into a column for each of the Opportunity Stages. It’s a classic Sales Pipeline report.
- Drilling – Summarised reports contain summarised data – counts, totals, averages and so on. You will see a single cell, containing a value that is the summary of several records e.g. all Opportunities at ‘(4) Won’. If you hover over the summarised cell (as illustrated below) you can drill into the data to see the underlying records.
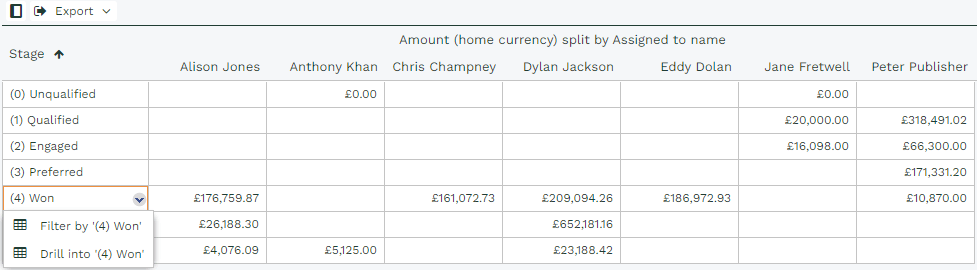
- Filtering – Filtering allows you to refine the criteria of the report. For example, the screenshot above shows stages. Selecting “(4) Won'” will return the relevant data (other stages are excluded). This allows you to focus on that data, but you can also amend the filter or drill into the data as explained above.
- Accounting Period and Calendar range filters – Further functionality to the Report can be introduced, for example showing all Opportunities in ‘(4) Won’ relevant to the last Accounting Period. This range filter will not need to be amended to keep up-to-date.
- Sharing – Unless the default Workbooks Permissions have been changed, reports are only available to the User that created them and members of the System Administrator Group. Therefore, if you want other Users to access the report, you’ll need to click the Sharing padlock on the top right of the report and apply the relevant rule(s).
- Wrapping – Report column headers will wrap by default.
Main tab
This is where you enter information about the report, and how you want it to run. Most of the buttons at the top of are available on most Workbooks screens. You can Watch the report, which will add it to your My Reports view. You can Share the report by clicking the Sharing Padlock and adding a rule. Save & Run and Add Summary View are explained later. Here’s an explanation of the fields:
- Report Name – Give the report a meaningful name.
- Description – What does the report do? Who uses it? Does the report do any calculations that may not be obvious at first glance? Enter a description to help anyone viewing the report to understand exactly what it does.
- Category – Set a category to make the report easier to find. The values in the categories list can be maintained in Picklists
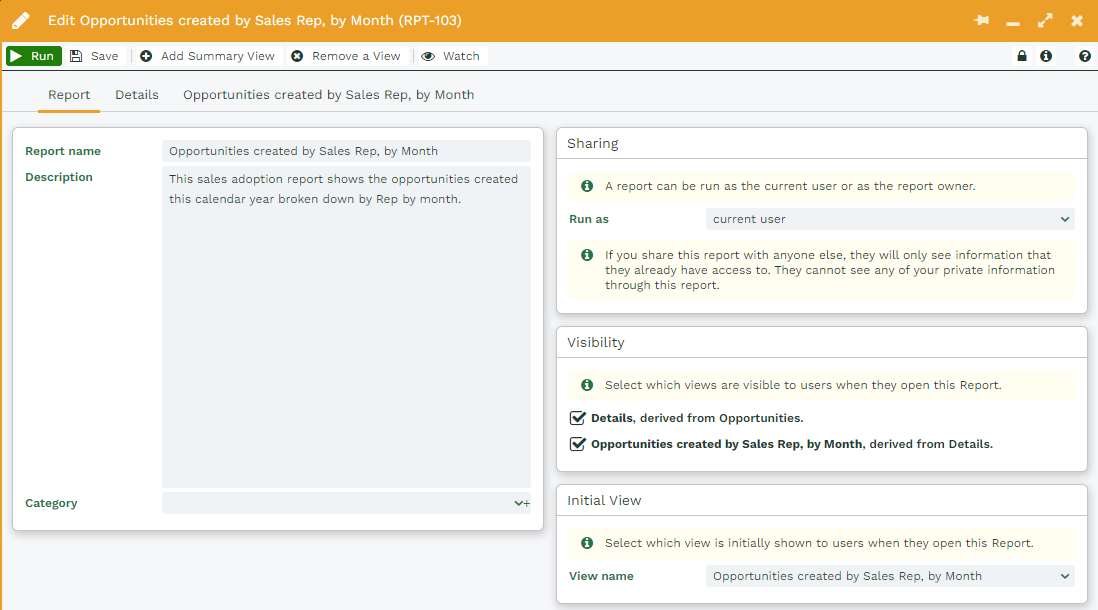
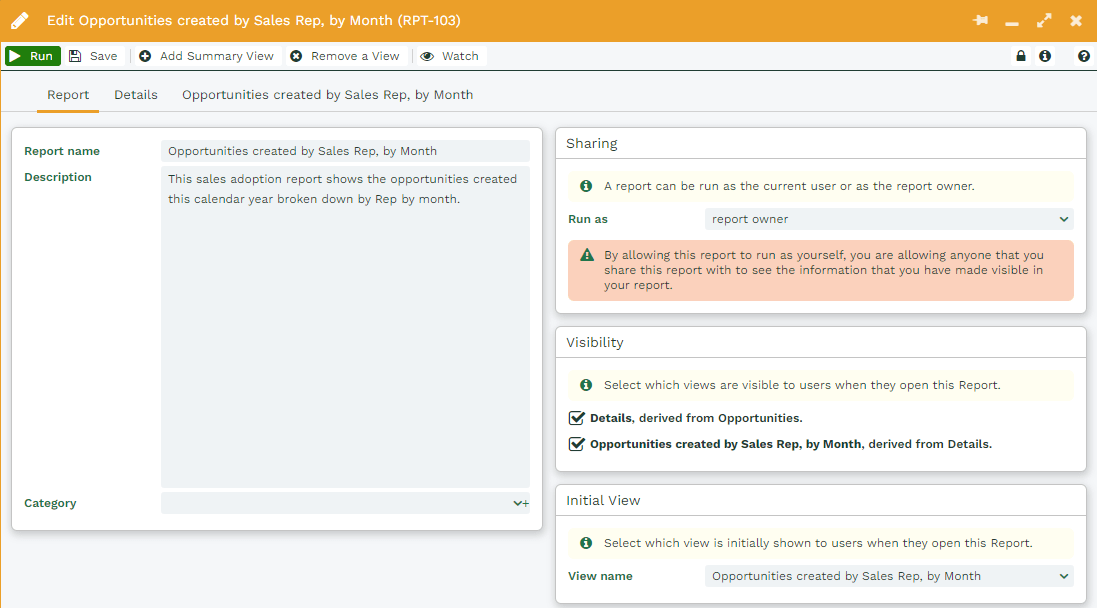
- Run as – Access to records can be restricted using Permissions (Sharing Policies & Mandatory Rulesets). This means users may have different levels of access to records and thus see different results from those seen by the Owner (usually the User that created the Report).The User who created the Report may see 150 records, but a User with more restrictive Permissions may see fewer records. If you want the User to see the same results as the Owner change “Run as” to “Report Owner”.
- Current User – If you share this report with anyone else, they will only see information that they already have access to. They cannot see any of your private information through this report.
- Report Owner – By allowing this report to run as the report owner, you are allowing anyone with whom you share this report to see all the information that the owner can see.
- Visibility – As mentioned above, reports can have multiple Views and you must create a Details View before a Summary View. Consider a scenario where you’re happy for summarised data to be displayed e.g. a figure of £82,000, which consists of 4 separate Opportunities, but you don’t want users to be able to drill into the data to see the details of those 4 Opportunities – you just want the target audience to see summarised figures.To achieve this, untick the Details view, and leave the Summary View ticked. Users will be able to see the Summary view, but not the Details.
- Initial View – This simply defines which View is displayed by default when the Report is opened. If you have multiple views you can switch between them using the tabs. Maybe you require users to be taken to the Summary view first. From there they can drill into the Details view if they’ve been given access to it.
Details tab
This is where the Report is defined. The Columns, Criteria and Automation tabs are explained below. Which columns do you want to be displayed? What criteria are you going to use to restrict the results shown in the report?
From a details view in a report, you are able to see the type of Record that the report is based on; this is useful to consider when you are doing more complex reporting such as Audit reporting.
The same can also be done for Summary Views, but instead of seeing the Record type that the report is based on, you will see which Parent view the current Summary View relates to.
Summary tab
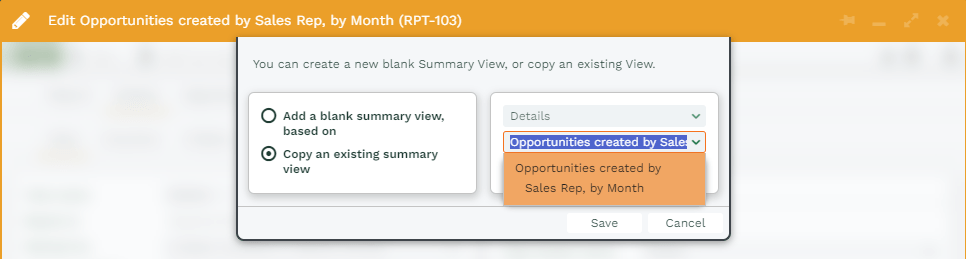
When creating new Summary Views within a report, you will be presented with the choice of whether you wish to create a new blank view, which is based on a previous view; or you can select to make a copy of an existing Summary View, which will be based on the same View as the original record.
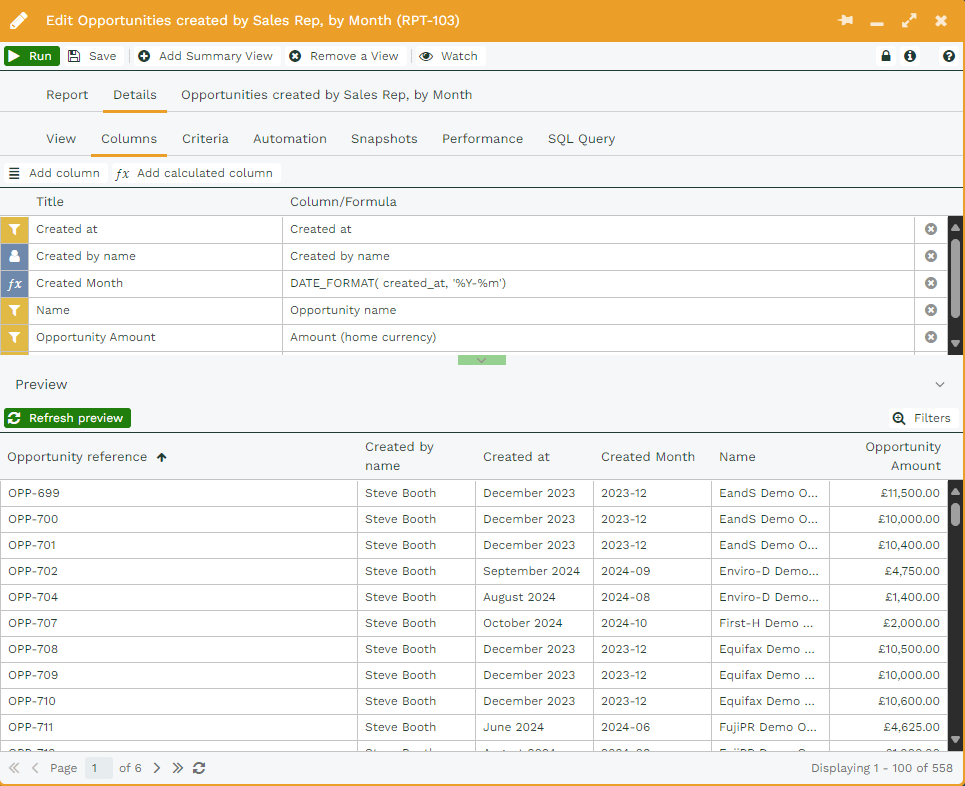
Columns tab
This is where you add the columns you want to see displayed in the report. Columns are either pulled straight out of Workbooks, in which case you use the Add column button, or you can perform calculations on the columns using the Add calculated column button.
NOTE: You can add many columns then click the “Refresh preview” button on the left side of the screen. The preview doesn’t refresh automatically as it would slow down the process of adding columns.
Adding a column
This allows you to select a column from the record type on which the report is based e.g. Opportunities. You select a column directly from the Opportunity record e.g. Opportunity Stage. Alternatively, you can display information in your report that is held on related records.
NOTE: If a description is used to describe what the field is doing. This will make building reports easier as the description will display when selecting which column you wish to add to the report.
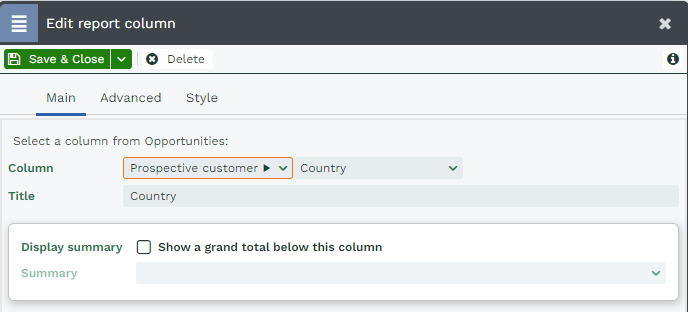
For example, an Opportunity has a Prospective Customer Field (which can be populated with either an Organisation or Person name, depending on whether you sell B2B or B2C). Using any of the options that include drill-throughs (i.e. the black triangle) you can link through to other records and select fields from that record. Therefore, you could display the Prospective Customer’s Country field if you wanted to analyse which countries your Opportunities were coming from.
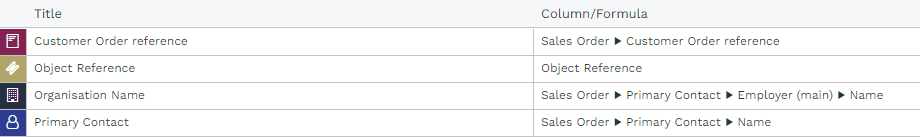
Further, any drill throughs you select here will be reflected in the main editing screen, as shown below.
Adding multiple columns
When adding report columns, it is possible to retain the drill through options in the column picker after clicking ‘Save & New’. This means that you can pick another attribute or multiple attributes from the same record type. This also applies when setting criteria.
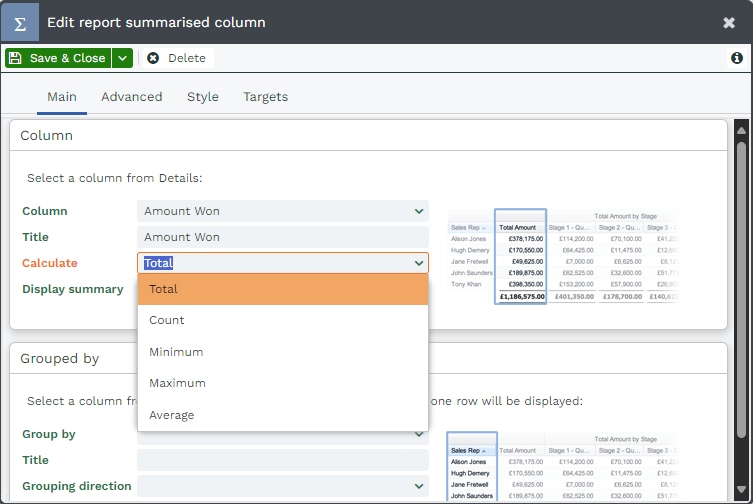
 Depending on the type of data that you’re adding to your report, you might want to show a total, a count or the minimum/maximum value from the values in the column, which you can do by clicking in the Display Summary checkbox, which then allows you to use the dropdown picklist next to Summary to select the value that you want to see.
If you wanted to see a count of the number of Opportunities, for example, you could add a column for the Object Reference and display the count at the bottom of the column. However in some circumstances adding a summary wouldn’t make sense – adding a total summary to a text field, for example.
Adding a calculated column
As described above, formulae are used to manipulate the data. For example, you can use a CONCAT (concatenate joins fields and values together) function to append a person’s employer to their person name, enclosed in brackets e.g. “Joe Bloggs (JB Limited)”.
This means you can have multiple fields displayed in a single column. This is achieved using a formula. It’s very similar to how formulae in spreadsheets work, but you define the formula on the column. There’s no need to copy the formula to all rows in the report. Workbooks will do this automatically.
Check out the Using formulae page for additional examples. CONCAT is a commonly used function as are basic mathematical expressions e.g. Probability * Amount / 100 – this gives a weighted forecast value. You could have 2 columns: one for “Best Case”, which simply uses Amount, and a calculated column for the “Weighted Forecast”.
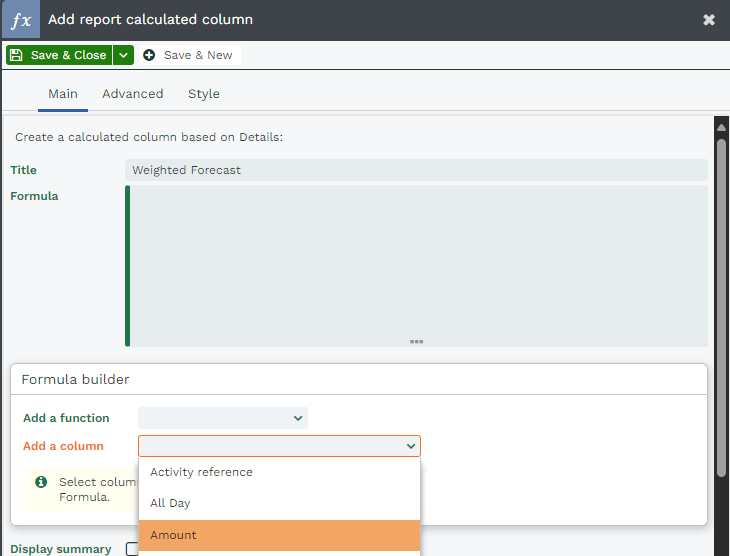
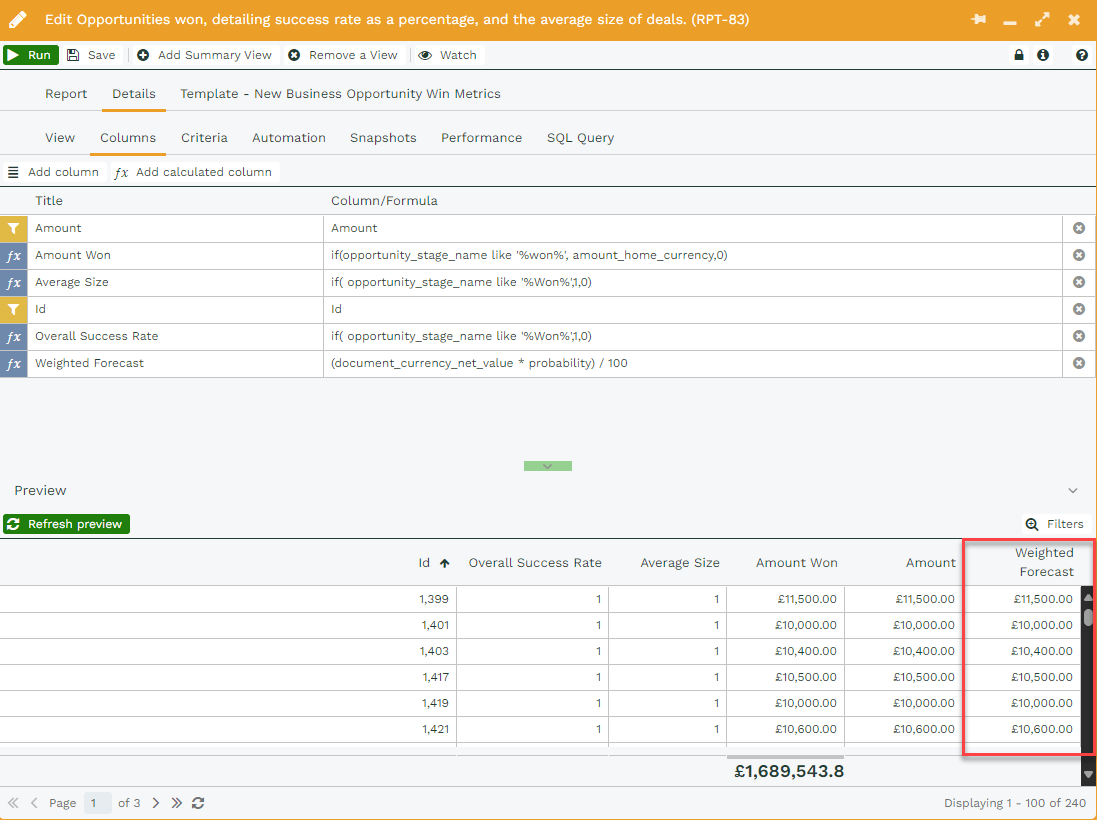
In this example, we demonstrate how to add a calculated column, which works out the “weighted forecast” by multiplying the Amount of the Opportunity by the percentage Probability, then dividing by 100.
- Click Add Calculated Column.
- Give the column a Title, in this example “Weighted Forecast”.
- Build the formula using the Formula builder – you can also free-type, which you will need to do at times e.g. to divide by 100.
- Use the Add a column selector to add the Amount column.
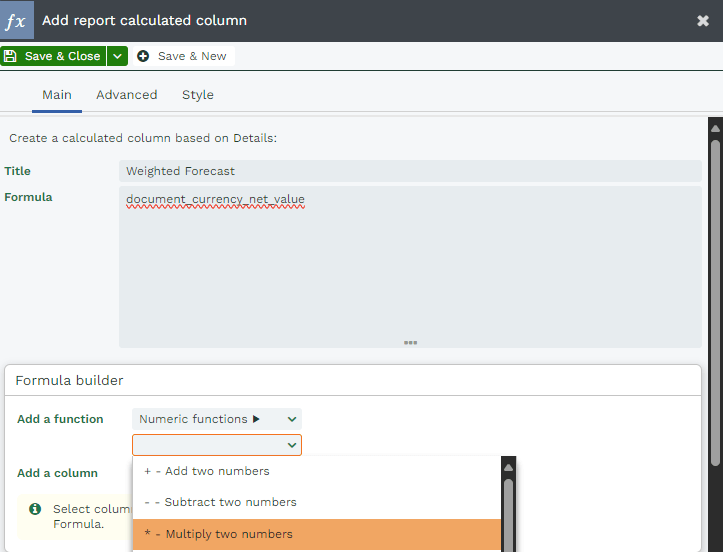
- Use the Add a function column to select the multiplication function from the list of Numeric functions.
NOTE: You can also free-type any symbols and brackets etc.
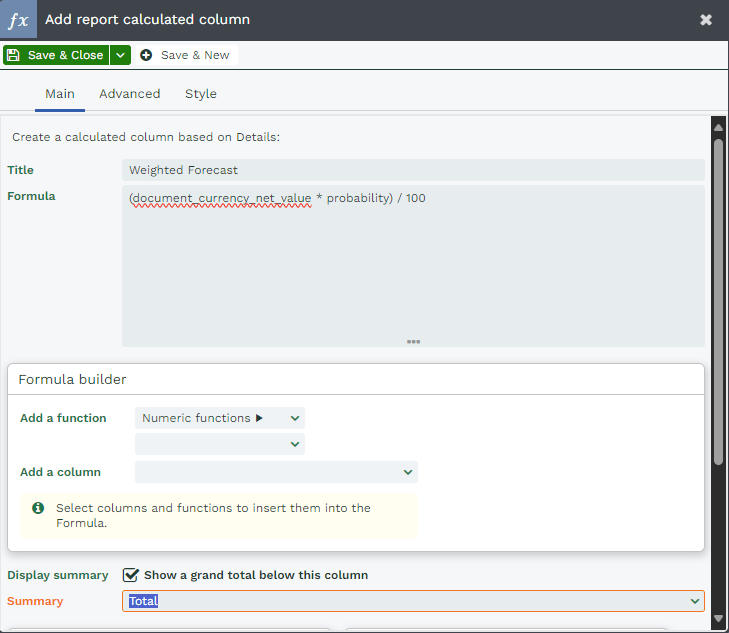
- Build the Formula to achieve this result:
(document_currency_net_value * probability) / 100 - Also use the Display summary option to display a grand total
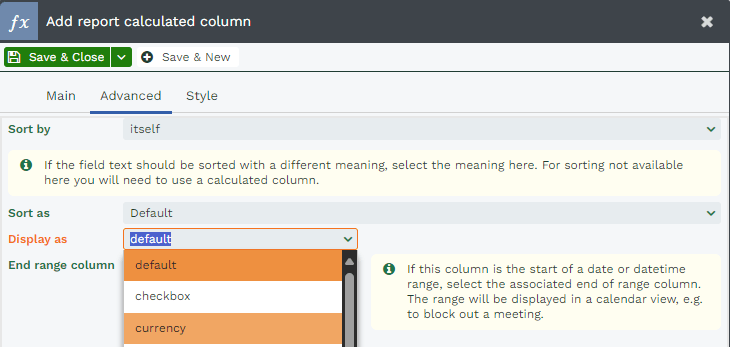
- Use the Advanced tab to display the column as a currency.

- Here we see the result. Remember you’ll need to click Refresh preview to see the calculated column (or any changes you make to the report).
Advanced tab
Sort by
When you click a column header the data is sorted in either ascending or descending order. Sometimes it’s more important that data is sorted by another value.
For example, you might want to see a list of invoices displayed in Invoice Date order rather than by the Invoice Number. In this situation, you could use the Advanced tab on the Invoice Number column and select to sort by Invoice Date.
NOTE: You can only sort by values from a column that you’ve already added to your report.
Display as
Contains formatting options. A common example is that a calculated column’s value may not automatically be displayed as a currency. Select Currency to display the value as a currency. Another alternative is to choose to display as time relative to now. This will only work on a Date/Time field, such as Created at or Updated at and will output values such as ’10 days ago’.
NOTE: If you set the “Display as” to a date it is recommended to do this from the Summary tab. This is because setting the “Display as” to a date on the Details tab will change the column into a string value and will mean you will not be able to add date filters when adding a criteria for this in a Summary view.
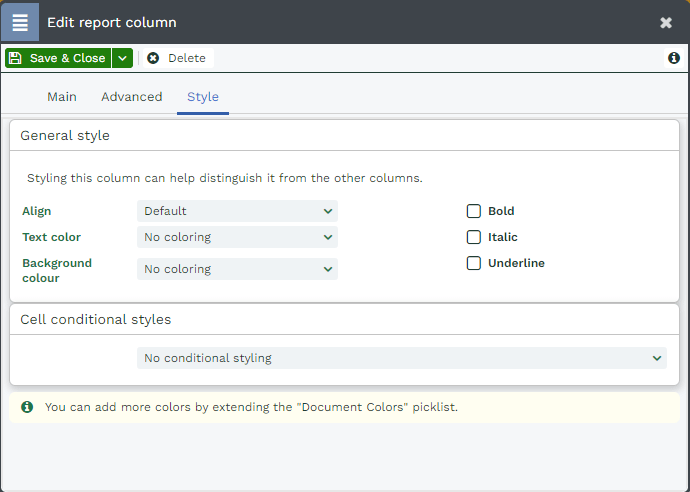
Style tab
Add styling based on the values in a column to make it stand out. Particularly useful for Value / Total columns.
You can find further guidance about how to use this on our Targets, Conditional Formatting and CSS Styling page.
Criteria tab
When you first create a report it doesn’t have any criteria applied to it (unless you’ve created the report from a template or by copying an existing one which already has one or more criterion applied), the report will show you data from all the records on your database.
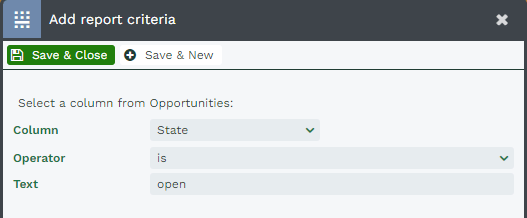
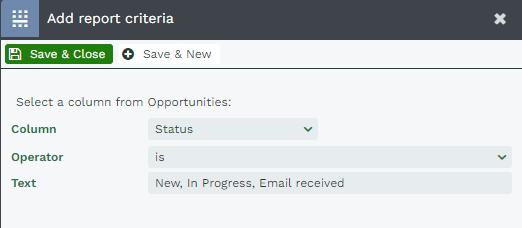
You can use criteria to limit the results based on attributes of the records. For example, you might want to limit a report on Cases to just those that are Open, in which case you would open the Criteria tab, choose Record state from the dropdown picklist next to Column, then use the picklist next to Operator to select is and type open in the text field, as shown below:
If you want to limit a report to multiple options, e.g. when field is value 1 or value 2 or value 3, then you can comma separate the values like below:
You can apply as many criteria as you want to focus in on the set of records you want to appear in your report. You might want to apply different criteria to different summary views of your data – for example, you might want one summary to show records created last week and another to show records created this week, all based on the same set of records in your details view.
Date criteria can be added easily. If you want to see records that fall into a particular date range that is relevant to today’s date, for example, choose an operator that is based on calendar range or accounting periods, which will provide you with a pre-determined list of options, as shown below.
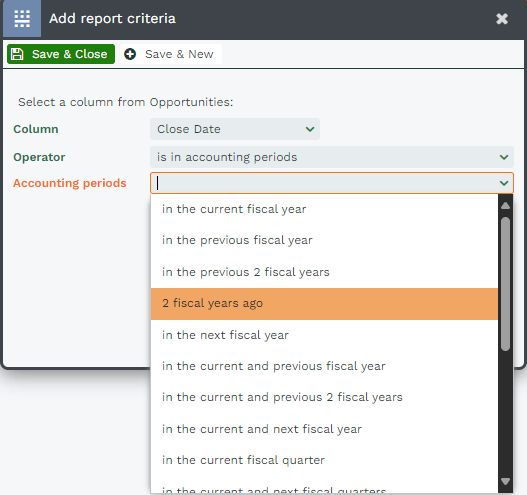
Alternatively, if you want to see records that fall into a fixed date range you could use an operator such as ‘on or after’ and then specify an exact date.
NOTE: The Add target set criteria option is only applicable if you’re using a Target Set in your report (and even then, only in specific circumstances). In general usage, there’s no need to use this option.
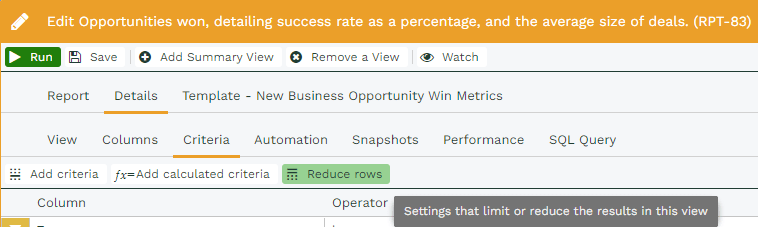
Reduce Rows
The Reduce rows function in reporting can be used to help you reduce the size of your reports.
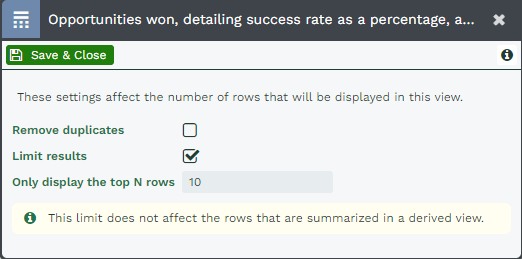
Upon clicking the button, you will be given two options for how you wish to tidy up your report; the first being to remove duplicate rows.
The second option is to limit the results to a specified number of rows; this is particularly helpful if you are looking to create reports that only show the Top 10 salesmen of the month, or highlight your most important and profitable accounts, without creating a report that leaves you with thousands of rows of irrelevant data.
NOTE: You can apply an ‘or’ operator to text criteria by using a comma. For example, if you want to display Opportunities that are at either Stage 1 or Stage 2, you would enter in the Text box: Stage 1, Stage 2.
Automation tab
It’s possible to perform a Bulk Action on a Report by running a Script against the records identified in the Report. For information on how to set this up, click here.